BRISK ATLAS / GUIDES
Supplier scorecard metrics: formulas and 1–5 scoring
A supplier performance scorecard usually measures delivery, quality, responsiveness, invoicing and price, and each needs a formula and a banding rule before it can be weighted. Below are five metrics you can calculate from purchase-order, receiving and invoice data, the bands that turn them into 1–5 scores, and one vendor’s quarter worked through.
Five metrics and their formulas
| Metric | Formula | Data | Harbor Supply, Q3 2026 |
|---|---|---|---|
| On-time in-full (OTIF) | Deliveries on time and complete ÷ all deliveries × 100 | Order due dates, receipt dates and quantities | 203 ÷ 212 = 95.8% |
| Defect rate (PPM) | Defective units ÷ units received × 1,000,000 | Receiving inspection or returns | 31 ÷ 48,000 × 1,000,000 = 646 |
| Responsiveness | Median hours from your request to a useful reply | Email or ticket timestamps | 6 h |
| Invoice accuracy | Invoices matching PO and receipt ÷ all invoices × 100 | Accounts-payable exceptions | 58 ÷ 58 = 100.0% |
| Price vs. contract | (Invoiced unit price ÷ contract price − 1) × 100 | Invoices and the price list | +1.2% |
OTIF counts a delivery only when it is both on time and complete; Wikipedia’s DIFOT article gives the formula as OTIF deliveries ÷ total deliveries × 100 and notes that some organisations count orders or order lines instead. Pick one and keep it for every vendor.
Turning a metric into a 1–5 score
A scorecard needs every criterion on the same scale, so each measured value is placed in a band. These are the bands used in the example; they are a choice, not a standard. Set yours from what your operation needs, before you look at the quarter’s data, so nobody adjusts a band to rescue a favourite.
| Metric | Bands (score: value) |
|---|---|
| On-time in-full (OTIF) | 5: ≥ 98% · 4: ≥ 95% · 3: ≥ 90% · 2: ≥ 85% · 1: otherwise |
| Defect rate (PPM) | 5: ≤ 250 PPM · 4: ≤ 500 PPM · 3: ≤ 1000 PPM · 2: ≤ 2500 PPM · 1: otherwise |
| Responsiveness | 5: ≤ 4 h · 4: ≤ 8 h · 3: ≤ 24 h · 2: ≤ 48 h · 1: otherwise |
| Invoice accuracy | 5: ≥ 99% · 4: ≥ 95% · 3: ≥ 90% · 2: ≥ 85% · 1: otherwise |
| Price vs. contract | 5: ≤ 0% · 4: ≤ 2% · 3: ≤ 4% · 2: ≤ 6% · 1: otherwise |
Defect rate, reply time and price are lower-is-better, so their bands run the other way: the smallest value earns the 5. Keeping “higher score is better” everywhere is what lets the weighted sum work.
One quarter, worked through
Harbor Supply in Q3 2026: OTIF 95.8% scores 4, 646 PPM scores 3, a 6-hour median reply scores 4, 100% invoice accuracy scores 5 and prices 1.2% over contract score 4.
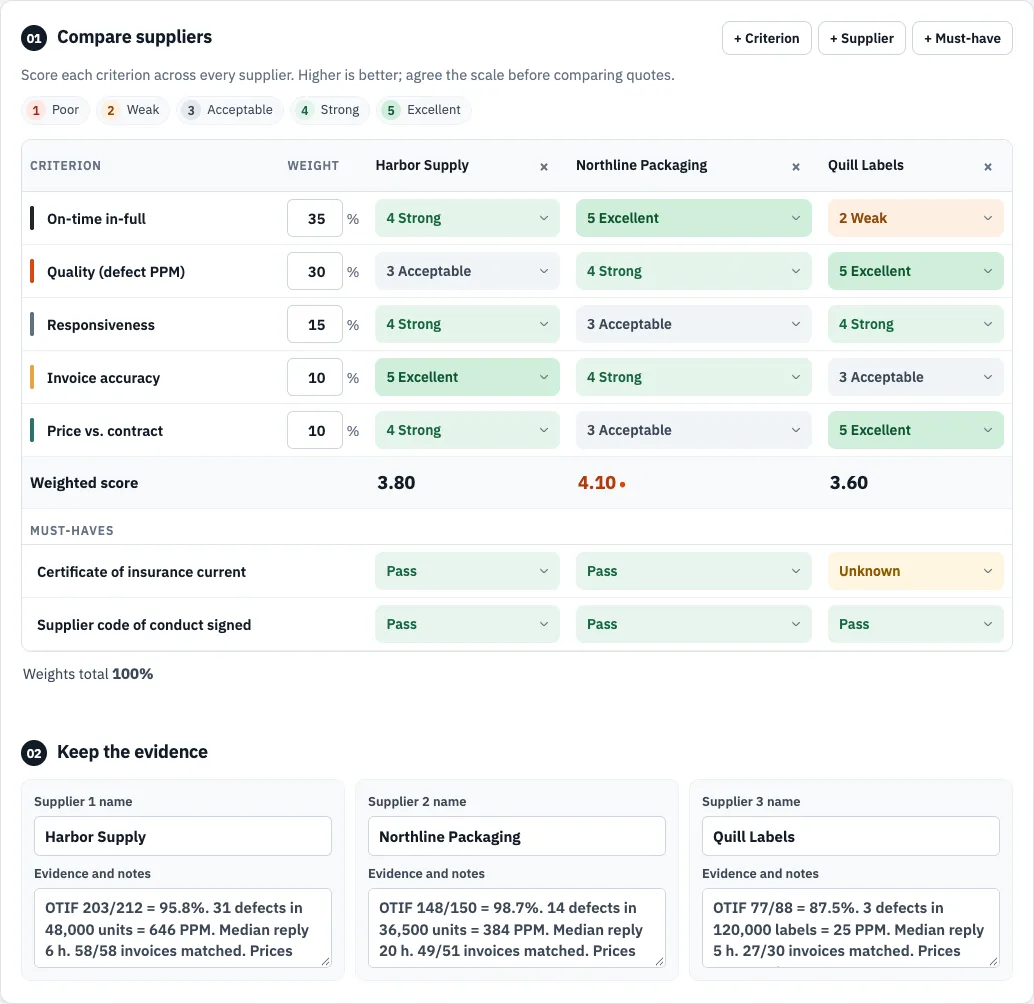
How these scores are weighted, compared across three vendors and turned into actions is in the vendor scorecard guide.
Promise date or request date?
Decide which date “on time” is measured against. Research cited by Wikipedia found that suppliers meeting an OTIF target against the date they promised often missed it against the date the customer requested. A vendor that renegotiates every due date can look perfect against its own promises.
Questions
What is a good OTIF percentage?
It depends on the industry and on which date you measure against. Wikipedia cites research describing leading practice in UK retail as more than 97% OTIF at SKU level; the bands above give a 5 from 98%.
How does PPM relate to a percentage?
Divide by 10,000: 646 PPM is 0.0646% of units. PPM is used because good suppliers’ defect percentages are too small to compare easily.
Should the scorecard include price?
On a performance review, compare invoiced prices with the contract rather than with other vendors’ quotes; quote comparisons belong to the selection scorecard.
Sources
Sources opened on 29 October 2026. All other figures are calculated on this page from the example scores.
More guides
- Supplier scorecard template (Excel, CSV and printable)Excel workbook with formulas, a blank CSV and a printable PDF.
- Supplier scorecard examples: three filled-in samplesPackaging, contract manufacturing and freight, scored and explained.
- Supplier evaluation criteria: what to score and what to gateMust-haves versus weighted criteria, with a worked counter-example.
- Weighted scoring model: formula, example and ExcelThe formula, a project selection example and the Excel version.
- Vendor scorecard: running a quarterly vendor reviewA worked quarterly review of three current vendors.